
Financial KPI examples every South African SME needs

Executive Summary
- South African SMEs must tailor financial KPIs to local risks like load shedding and currency volatility.
- Critical KPIs include adjusted gross profit margin, cash flow runway, and debtor days, adjusted for local conditions.
- Monitoring and acting on a few relevant KPIs regularly enables SMEs to navigate economic and operational shocks effectively.
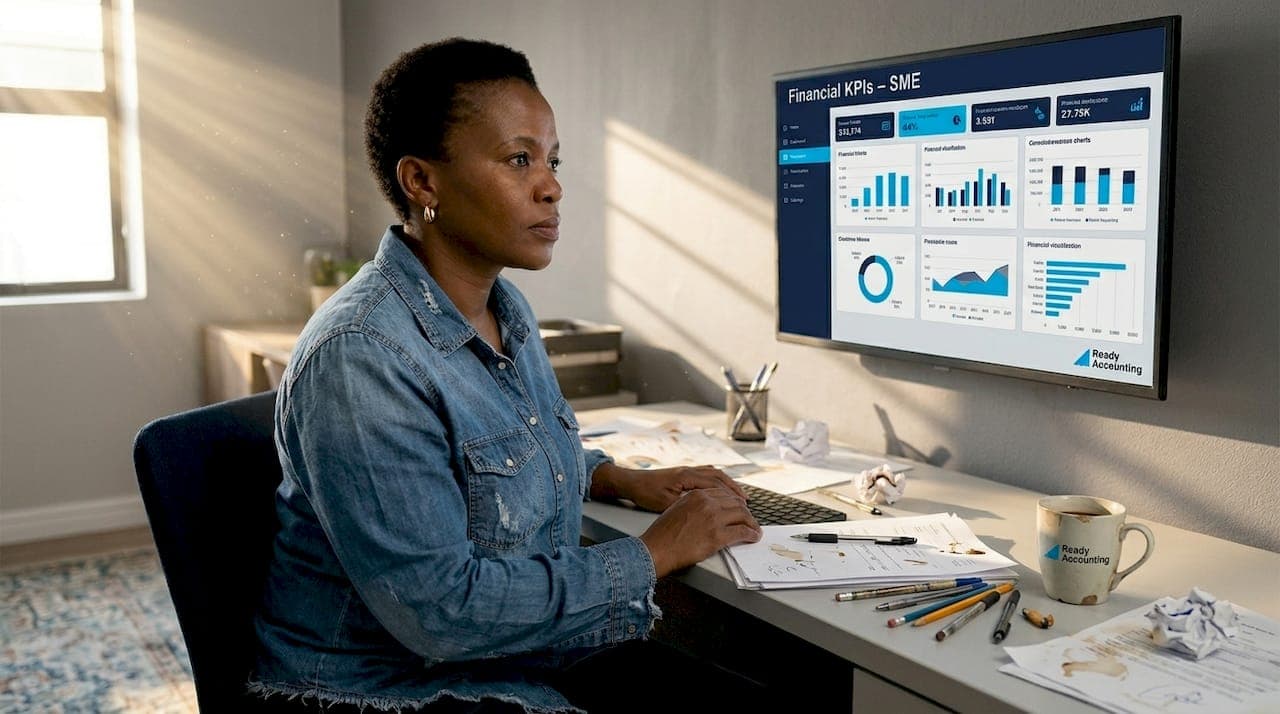
Most South African SME owners know they should be tracking financial KPIs. Very few are tracking the right ones. The difference between a business that survives load shedding, rand volatility, and a sluggish collection cycle, and one that quietly runs out of cash, often comes down to whether the owner is watching the correct numbers. 70% of SA SMEs fail within their first five years, and a major contributor is measuring performance with generic, globally designed metrics that ignore local realities. This article gives you practical, industry-adapted financial KPI examples you can start using immediately.
Table of Contents
- How to select and adapt financial KPIs for South Africa
- The top 7 financial KPI examples for South African SMEs
- Comparing key KPIs across industries
- Monitoring, interpreting, and acting on your KPIs
- Why getting KPIs right is the real game-changer for South African SMEs
- Get expert support and streamline your KPI tracking
- Frequently asked questions
Key Takeaways
| Point | Details |
|---|---|
| Localize your KPIs | Tailoring KPIs to South African risks like currency volatility and power disruptions makes them more effective. |
| Track core metrics | Focus on 5-7 main KPIs such as cash flow runway and debtor days for practical insight. |
| Industry benchmarks matter | Use industry-specific benchmarks instead of global figures to measure your SME’s true performance. |
| Act quickly on trends | Review KPIs often and adjust your business strategy at the first sign of negative trends. |
| Automate for consistency | Leverage technology and expert support to track KPIs efficiently and avoid common errors. |
How to select and adapt financial KPIs for South Africa
The most common mistake South African SMEs make is downloading a KPI template from a global business blog and applying it without adjustment. That approach is like using a European weather forecast to plan a Cape Town winter. The framework might be logical, but the local variables will catch you off guard.
Standard KPIs like profit margins and liquidity ratios apply universally but must be adjusted for SA-specific risks like currency volatility, load shedding, and longer debtor days. A retail business in Johannesburg faces meaningfully different cash pressure than one in Germany or the UK, even if both report a healthy gross profit margin on paper.
Here is a practical process for building your KPI set:
- Start with your strategic goals. A business focused on growth needs different KPIs than one focused on survival or profitability. Before picking metrics, write down your top three financial priorities for the next 12 months.
- Apply the SMART filter. Each KPI must be Specific, Measurable, Achievable, Relevant, and Time-bound. “Improve cash flow” is not a KPI. “Reduce debtor days from 52 to 38 by Q3 2026” is one.
- Limit your dashboard to 5 to 7 core KPIs. More metrics create noise, not clarity. If you cannot explain what action to take when a KPI moves, it probably does not belong on your dashboard.
- Pair lagging and leading indicators. Lagging indicators like net profit margin tell you what happened. Leading indicators like your pipeline conversion rate or debtor days trend tell you what is about to happen. Setting financial goals effectively requires both types in view at once.
- Account for local shocks. Factor load shedding costs into your cost of goods sold, adjust your cash flow runway targets upward to absorb rand depreciation risk, and build debtor day benchmarks around South African payment culture rather than international norms.
Pro Tip: If you are tracking KPIs manually in a spreadsheet, block out 30 minutes every month on the same date to update your numbers. Consistency beats sophistication. Many businesses that struggle with SME profitability strategies do so not because they lack data, but because they review it inconsistently.
A useful test: Ask yourself, “If this number moved by 10% next month, would I change a decision?” If the answer is no, replace the KPI with one that would.
Understanding financial health indicators in a South African context is not optional. It is foundational. Once you have the selection framework in place, the next step is knowing exactly which metrics deserve a spot on your dashboard.
The top 7 financial KPI examples for South African SMEs
These seven KPIs are not just globally recognised metrics. Each one has been selected and explained with the South African operating environment in mind.
1. Adjusted gross profit margin Formula: (Revenue minus Cost of Goods Sold, adjusted for load shedding costs and FX exposure) divided by Revenue, multiplied by 100. This KPI shows how efficiently your core business generates profit before overhead. In South Africa, you must include generator fuel, UPS replacements, and foreign-denominated input costs in your COGS or the number is misleading. Benchmark: Retail 25 to 35%, Manufacturing 20 to 30%, Tech services 50 to 70%.
2. Net profit margin Net Profit Margin = (Net Profit / Revenue) x 100, and it is one of the top financial KPIs for South African small businesses. It tells you how much of every rand of revenue becomes actual profit after all costs. A declining net margin while revenues grow is a red flag worth investigating immediately.
3. Cash flow runway This is arguably the most critical KPI for South African SMEs. Cash flow runway measures how many months of operating expenses your business can cover from current reserves, adjusted for rand volatility and load shedding disruptions. Benchmarks: Manufacturing 6 to 8 months, Retail 4 to 6 months, Services 3 to 5 months. If your runway is shorter than the benchmark for your sector, you are operating without a safety net.
4. Working capital ratio Formula: Current Assets divided by Current Liabilities. A ratio above 1.5 is generally considered healthy. This KPI reveals whether your business can cover short-term obligations without selling long-term assets or taking emergency credit. Review your financial statement basics to extract this figure accurately from your balance sheet.
5. Debtor days Formula: (Accounts Receivable divided by Annual Credit Sales) multiplied by 365. Debtor days tells you how long it takes your customers to pay. In South Africa, particularly in sectors like construction and professional services, debtor days routinely stretch far beyond what international benchmarks suggest is normal. If this number climbs steadily, your business is effectively financing your customers.
6. Customer acquisition cost to lifetime value ratio (CAC:LTV) This KPI bridges financial performance and commercial strategy. If it costs you R5,000 to acquire a customer who generates R8,000 in lifetime profit, your ratio is 1:1.6. A ratio below 1:3 in most service businesses suggests your acquisition model is not yet sustainable.
7. Cash conversion cycle (CCC) Formula: Debtor Days plus Inventory Days minus Creditor Days. The common financial KPIs list always includes CCC because it shows how efficiently you convert investment in inventory and receivables into cash. A negative CCC, where you collect from customers before you pay suppliers, is a competitive advantage.
Pro Tip: Track debtor days and cash flow runway as a pair. Rising debtor days drains your runway faster than almost any other single variable in an SME. Review business health indicators monthly to spot the pattern early.
Comparing key KPIs across industries
The same KPI can signal very different things depending on your sector. A 45-day debtor days figure looks alarming for a retailer but is entirely normal for a construction firm. Using the wrong benchmark leads to wrong decisions.
The table below compares three core KPIs across South Africa’s most common SME sectors:
| Industry | Cash flow runway | Adjusted gross profit margin | Debtor days |
|---|---|---|---|
| Manufacturing | 6 to 8 months | 20 to 30% | 30 to 50 days |
| Retail | 4 to 6 months | 25 to 35% | 15 to 30 days |
| Tech and professional services | 3 to 5 months | 50 to 70% | 30 to 45 days |
| Construction | 6 to 9 months | 18 to 28% | 45 to 60 days |
These industry benchmarks come with an important note: they represent healthy performance under normal South African operating conditions. During periods of intense load shedding or significant rand depreciation, you should shift your target cash flow runway upward by at least one month per category.
Retail businesses tend to have the shortest debtor days because most transactions are point-of-sale. The risk for retailers shows up instead in inventory days and gross margin compression. Manufacturing businesses carry longer runways because their cost base is heavier, their supply chains are less flexible, and many have significant FX exposure on imported inputs.
Key insight: If your KPIs look healthy but you are constantly feeling cash-stressed, the disconnect is often in your debtor days or inventory holding period. The numbers are there. You just need to know which ones to read.
Reviewing sample SME financials for businesses in your sector gives you a realistic baseline for comparison, rather than relying on aspirational benchmarks from international sources that have no context for your operating environment.
Tech services businesses show the highest gross margins but often underestimate the working capital pressure that comes from fast growth. A SaaS or consulting firm growing at 40% per year can have an excellent gross margin and still face a cash crisis if its invoicing and collection processes cannot keep pace.
Monitoring, interpreting, and acting on your KPIs
Selecting the right KPIs is step one. Using them to make better decisions is the whole point. Many SME owners track numbers and then do nothing with them until a crisis forces their hand. That is not KPI management. That is record-keeping.
Here is a practical monitoring framework:
- Set your review rhythm. Monthly is the minimum. Weekly cash flow runway reviews are appropriate for businesses with less than three months of reserves or those experiencing rapid growth or contraction.
- Create action thresholds. For each KPI, define the number that triggers a conversation or a decision. For example, “If debtor days exceed 50, we stop extending credit to that client and escalate to collections.”
- Separate trending from noise. A single bad month does not define a trend. Two or three consecutive months of movement in the same direction does. Start with 5 to 7 core KPIs aligned to your goals, use SMART targets, and review consistently before drawing conclusions.
- Track the cash conversion cycle closely. A negative CCC is desirable because it means you collect cash before paying suppliers. If your CCC is widening, you are moving in the wrong direction and need to examine either your receivables process or your supplier terms.
- Automate where possible. Manual spreadsheets introduce error and delay. Cloud accounting platforms paired with real-time dashboards give you KPI visibility without the weekly data-capturing burden. Sustainable SME growth becomes far more achievable when your data is current and accurate rather than three weeks stale.
Common warning signs to watch:
- Cash flow runway dropping below your sector benchmark for two consecutive months
- Debtor days increasing while revenue holds steady, indicating your collection process is breaking down
- Working capital ratio falling below 1.2, which creates real short-term payment risk
- Gross margin compressing without a corresponding change in strategy, which often signals cost creep or pricing pressure that has not yet been addressed
Pro Tip: Use your KPI dashboard as the agenda for your monthly financial review meeting, even if that meeting is just you and your accountant for 45 minutes. Decisions made from a structured KPI review are almost always better than those made reactively.
Consider how the approach to unlocking SME profitability shifts when you have clear, current data. Instead of guessing where margin is leaking, you can pinpoint it. Instead of hoping cash will hold, you know exactly how many months of runway you have and what levers to pull.
Why getting KPIs right is the real game-changer for South African SMEs
Most KPI advice you will find online treats this as a technical exercise. Pick the metrics, plug in the formulas, report the numbers. That framing misses what actually separates businesses that use KPIs well from those that just collect them.
The real game-changer is not which KPIs you track. It is how quickly you respond when they move. South African SMEs operate in an environment where a single week of severe load shedding can shift your cost base materially, where a rand move of 5% can flip your imported input costs overnight, and where a large client paying 30 days late can put your payroll at risk. Generic global KPI playbooks were not designed for that reality.
The businesses we see navigate these conditions most effectively share a common trait: they review their KPIs with the intent to act, not just to report. They look at statement examples in practice not as historical documents but as early warning systems. They adjust their targets quarterly when local conditions shift, and they know exactly which metric to pull when the business feels off before they can articulate why.
The conventional wisdom says track more KPIs for better visibility. The actual lesson from high-performing South African SMEs is track fewer, more relevant KPIs and respond to them faster. That combination is where the real advantage lives.
Get expert support and streamline your KPI tracking
Knowing which KPIs to track is only useful if your financial data is clean, current, and accessible. At Ready Accounting, we build real-time financial dashboards for scaling South African SMEs that surface the KPIs that actually matter for your industry, updated automatically without manual capturing. Our automation for healthier cash flow replaces reactive spreadsheet reviews with proactive alerts. We also help you improve financial reporting so your numbers are always decision-ready. If cash flow is your pressure point, our cash flow KPI guide goes deeper into the metrics and frameworks that protect your runway.
Frequently asked questions
What are the most important financial KPIs for a South African SME?
The most important KPIs are adjusted gross profit margin, net profit margin, cash flow runway, working capital ratio, debtor days, and cash conversion cycle. These core financial KPIs with formulas give you a complete picture of profitability, liquidity, and operational efficiency.
How often should I review my financial KPIs?
Review your KPIs monthly at minimum, and adjust your targets quarterly if conditions shift. Businesses that track 5 to 7 core KPIs consistently outperform those that review metrics sporadically or only during financial stress.
Why do benchmarks for KPIs differ by industry in South Africa?
Different industries carry different risk profiles, cost structures, and payment cycles. Cash flow runway benchmarks reflect this: manufacturing needs 6 to 8 months while retail can operate with 4 to 6, because retail collects cash far faster than construction or manufacturing.
What is debtor days and why does it matter?
Debtor days measures how quickly your customers settle their invoices on credit. High debtor days drain your cash flow runway even when your sales are growing, making it one of the most important KPIs for any business that invoices on payment terms.
What if my KPIs are getting worse but my sales are up?
Worsening KPIs alongside rising sales often signals a future cash crisis. A negative cash conversion cycle is desirable, but a widening one while revenue grows means your working capital is being consumed faster than your sales can replenish it. Act before the gap becomes a problem.