

How to read balance sheets for smarter business decisions
Executive Summary
- A balance sheet provides a snapshot of a business’s assets, liabilities, and equity at a specific time.
- Monitoring ratios like current ratio, debt to equity, and debtor days helps assess financial health.
- Regular analysis transforms the balance sheet into a strategic tool for growth and risk management.
A Johannesburg retail owner once expanded to a second location based on strong monthly sales, only to discover six months later that her business was technically insolvent. The balance sheet had been telling that story all along, buried under numbers she didn’t know how to read. For South African SMEs, this is not an unusual scenario. Your balance sheet is a real-time snapshot of financial health, and misreading it, or ignoring it entirely, can cost you in ways that no amount of hustle will fix. This article gives you a practical, plain-language framework to read and use your balance sheet with confidence.
Table of Contents
- Understanding the balance sheet: structure and basics
- Step-by-step: how to read your balance sheet
- Key ratios and what they say about your business
- Common pitfalls and advanced tips for South African SMEs
- A fresh perspective: why balance sheets are your growth roadmap
- Ready to make smarter decisions?
- Frequently asked questions
Key Takeaways
| Point | Details |
|---|---|
| Balance sheet basics | Understanding the structure helps you track your business’s financial health. |
| Key ratios matter | Analyzing ratios like current ratio and debtor days reveals risks and opportunities. |
| Avoid common mistakes | Watch for issues like overvalued inventory, non-liquid assets, and negative retained earnings. |
| Industry context is key | Always compare your numbers to benchmarks for your industry and business size. |
Understanding the balance sheet: structure and basics
Before you can extract value from a balance sheet, you need to understand what it actually is. A balance sheet is a financial statement that captures everything your business owns, everything it owes, and what’s left over for the owners, all at a specific point in time. It is not a record of income or expenses. That’s the income statement’s job. The balance sheet is a photograph, not a film.
Learning financial statement basics is the starting point for any serious business owner. Once you understand the structure, the numbers stop feeling like noise and start telling you something useful.
The three pillars of every balance sheet are:
- Assets: Everything your business owns or controls that has economic value. This includes cash, inventory, equipment, property, and money owed to you by customers (debtors).
- Liabilities: Everything your business owes to others. Loans, unpaid supplier invoices, tax obligations, and any other debts fall here.
- Equity: What remains after you subtract liabilities from assets. This represents the owners’ stake in the business, including retained earnings and contributed capital.
The fundamental equation that holds it all together is: Assets = Liabilities + Equity. This equation must always balance, which is where the document gets its name.
Here is a simplified structure to visualise a typical balance sheet:
| Section | Examples | Position |
|---|---|---|
| Current assets | Cash, debtors, inventory | Top left |
| Non-current assets | Property, equipment, intangibles | Below current assets |
| Current liabilities | Trade creditors, short-term loans | Top right |
| Non-current liabilities | Long-term debt, deferred tax | Below current liabilities |
| Equity | Share capital, retained earnings | Bottom right |
For South African SMEs, two benchmarks stand out immediately. SA SME benchmarks recommend a current ratio between 1.5 and 2, with debtor days ideally kept between 30 and 60. The current ratio tells you whether your business can cover its short-term debts using short-term assets. A ratio below 1 means you owe more in the short term than you have available to pay it.
Industry context matters enormously here. A retail business that turns over inventory quickly can often operate comfortably with a lower current ratio than a manufacturing firm sitting on slow-moving stock. Understanding your sector’s norms stops you from panicking unnecessarily, or worse, feeling falsely safe.
Step-by-step: how to read your balance sheet
Reading a balance sheet is a skill, and like any skill, it becomes faster and more intuitive with practice. Here is a structured approach to work through your own document without getting lost.
- Check the date. A balance sheet is always prepared as of a specific date. Make sure you’re reading the right period. Comparing a December balance sheet to last year’s March one will mislead you.
- Start with total assets. Scan the full list of assets. Are they growing? Shrinking? What’s driving the change?
- Separate current from non-current assets. Current assets convert to cash within 12 months. Non-current assets are longer-term holdings. A business with most of its assets tied up in non-current items like property or equipment may struggle to meet short-term obligations.
- Review total liabilities. Are your debts growing faster than your assets? This is a warning sign. Look at the split between current and non-current liabilities.
- Examine equity. Is retained earnings positive and growing? Shrinking retained earnings without a declared dividend or share buyback is a red flag worth investigating.
- Calculate your current ratio. Divide current assets by current liabilities. Compare to the SA SME benchmark of 1.5 to 2.
- Cross-reference with your income statement. A strong balance sheet paired with weak income tells a different story than a weak balance sheet with strong income.
When reading a balance sheet, pay close attention to how assets are valued. Inventory listed at cost may not reflect actual market value, especially if stock is slow-moving or obsolete. Equipment appears at cost minus accumulated depreciation, but the market value could be much lower.
Look at your examples of financial statements to see how these items appear in practice across different business types.
Pro Tip: When you see negative retained earnings on a balance sheet, don’t assume the worst immediately. Check whether the business recently bought back shares or declared large dividends. However, overvalued inventory and off-balance-sheet risks are a genuine concern, especially in asset-heavy industries where items are held at inflated book values while their actual worth has declined significantly.
One subtle trap worth calling out: off-balance-sheet items. These are obligations or assets that don’t appear directly on the statement but can materially affect your financial position. Operating leases structured in certain ways, contingent liabilities from pending legal disputes, and certain financing arrangements can all live outside the balance sheet while posing very real risk.
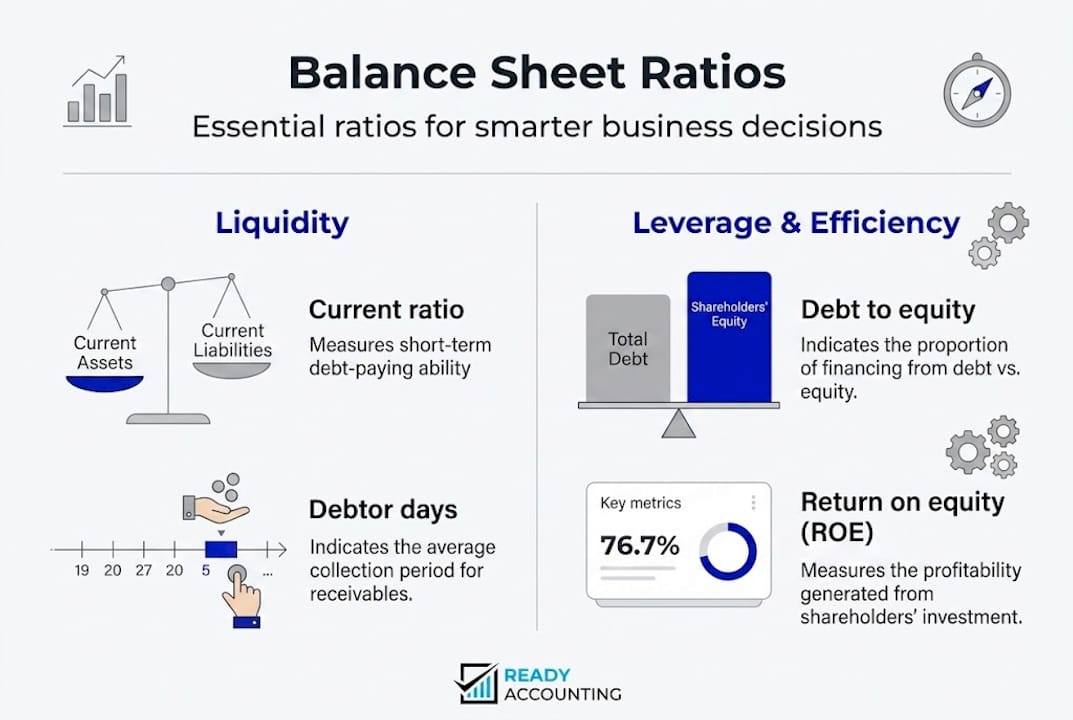
Key ratios and what they say about your business
Numbers on their own don’t mean much without context. Ratios transform raw balance sheet data into meaningful business intelligence. Here are the four you need to understand and monitor regularly.
Current ratio Formula: Current Assets divided by Current Liabilities This measures short-term liquidity. How easily can your business pay what it owes over the next 12 months? As noted, SA benchmarks suggest a range of 1.5 to 2 for most SMEs, though retail businesses with fast inventory turnover may operate closer to 1.2 without significant risk.

Debt to equity ratio Formula: Total Liabilities divided by Total Equity This measures how leveraged your business is. A ratio above 2 means creditors are funding significantly more of the business than owners are. That’s not automatically bad, but it increases vulnerability if revenue dips.
Debtor days Formula: (Debtors divided by Revenue) multiplied by 365 This tells you how long, on average, it takes customers to pay you. The recommended range for South African SMEs is 30 to 60 days. Beyond 60, your cash flow suffers, even if sales are strong.
Return on equity (ROE) Formula: Net Profit divided by Total Equity multiplied by 100 ROE tells you how efficiently the business uses owners’ capital to generate profit. A higher number generally indicates better performance.
| Ratio | Formula | Healthy SA SME range |
|---|---|---|
| Current ratio | Current assets / Current liabilities | 1.5 to 2.0 |
| Debt to equity | Total liabilities / Total equity | Below 2.0 |
| Debtor days | (Debtors / Revenue) x 365 | 30 to 60 days |
| Return on equity | Net profit / Equity x 100 | 15% and above |
Best practices for monitoring your ratios include:
- Review ratios monthly, not just at year end
- Compare to prior periods, not just to benchmarks
- Always consider ratios in combination, never in isolation
- Benchmark against your industry, using sector-specific data where possible
- Flag any ratio that moves more than 10% in a single period for closer review
To go deeper on interpreting these numbers, explore how to analyze financial statements in a South African context, and use an easy guide to financial statements to reinforce your understanding of how these documents connect.
A critical statistic worth noting: businesses that review financial statements monthly are significantly more likely to identify and address cash flow problems before they become crises. Many South African SMEs review annually at tax time, which is simply too late to course correct.
Common pitfalls and advanced tips for South African SMEs
Even business owners who make an effort to read their balance sheets can fall into patterns that distort their interpretation. Knowing what to watch for saves you from acting on bad information.
Common mistakes include:
- Ignoring depreciation. Assets lose value over time. If you’re not accounting for depreciation, your asset values are overstated and your true financial position looks healthier than it is.
- Treating inventory at face value. Slow-moving or obsolete stock is not worth what it cost you. Overvalued inventory inflates your current assets and creates a false sense of liquidity.
- Overlooking off-balance-sheet items. Lease commitments, guarantees, and pending litigation can all represent real financial exposure that doesn’t appear in the headline numbers.
- Ignoring negative retained earnings. Negative retained earnings without buybacks can indicate accumulated losses that deserve immediate attention.
- Comparing across periods without adjusting for context. A dramatic increase in assets might seem positive until you realise it’s all debt-funded acquisition.
South African SMEs face some locally specific challenges worth naming. Exchange rate exposure affects businesses with imported goods or foreign-currency debt. SARS compliance obligations create contingent tax liabilities that may not appear on the face of the balance sheet. BEE transaction structures can create complex equity arrangements that require careful reading.
Critical caution: Never make a major business decision, whether that’s taking on new debt, expanding operations, or bringing on an investor, based on a single financial statement or a single period’s ratios. Always compare at least three consecutive periods and review in context with your income statement and cash flow statement together.
Pro Tip: Look at changes in equity over time, not just the total. If retained earnings are growing steadily, that’s a business generating and reinvesting profit. If equity is only growing because of new capital injections, ask why the business isn’t funding its own growth.
Advanced readers should track equity movements using a statement of changes in equity, which shows exactly where equity increases and decreases came from across a reporting period. This document, often overlooked, is one of the most revealing financial tools available.
For a thorough guide to financial statements in a South African SME context, including how these statements interact with each other, that resource covers the full picture in practical terms.
A fresh perspective: why balance sheets are your growth roadmap
Here is what most accounting articles won’t tell you: a balance sheet isn’t a compliance document. It’s a strategic instrument. When you review it regularly and with intention, it becomes a map of where capital is being deployed, where risk is accumulating, and where opportunity is hiding.
The misconception that balance sheets are for accountants has cost South African entrepreneurs more than any tax obligation or bad loan ever has. When you outsource the reading entirely, you also outsource the decision-making intelligence.
Small and medium businesses actually have a structural advantage over large corporations here. You can act on what the balance sheet tells you immediately. A listed company needs board approval and stakeholder consultation. You can reallocate resources, renegotiate terms, or restructure debt in weeks.
Deeper financial understanding transforms the balance sheet from a backward-looking document into a forward-looking tool. The pattern of how your assets and liabilities are growing tells you exactly whether your current strategy is sustainable or whether you’re quietly building toward a crisis.
The businesses that outperform their peers in South Africa’s challenging economic environment are not always the ones with the best products. They are the ones whose owners know their numbers, act on them early, and use financial clarity as a competitive edge.
Ready to make smarter decisions?
Understanding your balance sheet is just the first step. The real power comes from building systems that keep your financial data accurate, current, and actionable without spending hours chasing it manually. Ready Accounting helps South African SMEs move beyond reactive bookkeeping by engineering real-time financial visibility using cloud infrastructure and automated reporting. Whether you’re focused on improving your business’s financial reporting or want to understand the cloud accounting benefits for small business growth, we can help you build a finance function that gives you a genuine competitive edge. Stop guessing. Start knowing.
Frequently asked questions
What is the most important ratio for a South African SME when reading a balance sheet?
The current ratio is widely considered the most critical starting point, with SA SME benchmarks recommending a range of 1.5 to 2, adjusted for your specific sector.
How often should I review my business balance sheet?
Monthly reviews are ideal for SMEs, giving you enough frequency to catch cash flow problems and emerging risks before they escalate into serious issues.
What are common mistakes when interpreting a balance sheet?
The most frequent errors include ignoring depreciation, treating slow-moving inventory at full value, and missing off-balance-sheet items and negative retained earnings that signal deeper financial stress.
Are there differences in balance sheets for different industries?
Absolutely. Key metrics like current ratio and debtor days shift meaningfully across sectors, and SA industry benchmarks reflect the distinct cash flow and asset structures of retail versus manufacturing and other industries.
Recommended
- Execution Framework: Read a Balance Sheet for SA Business Owners 2025 | Ready Accounting
- Mastering profit and loss for smarter business decisions | Ready Accounting
- How to Read Financial Statements: Easy Guide for 2025 - Ready Accounting
- Execution Framework: Interpret Financial Ratios for Better Business Decisions | Ready Accounting