

Stop SARS Tax Errors With a Gross Profit Spreadsheet for SA SMEs
Stop SARS Tax Errors With a Gross Profit Spreadsheet for SA SMEs
Gross profit is what’s left after you subtract the direct cost of making or buying what you sold from your revenue: Gross Profit = Revenue − Cost of Goods Sold (COGS). Turn that into a percentage with the gross profit margin formula: (gross profit ÷ revenue) × 100. The hard part isn’t the math. It’s getting COGS right.
Executive Summary
- Accurate classification of direct costs and consistency in stock counts are essential to reliable gross profit calculations and meaningful margin trends.
- COGS for retailers typically involves opening stock, purchases, and closing stock, while manufacturing includes raw materials, direct labor, and factory overhead.
- Service businesses often base COGS on direct labor and subcontractor fees, with no physical inventory involved.
- Misclassifying overhead like rent or salaries as COGS inflates gross profit and misleads profitability assessments.
- Maintaining a fixed stock count date and industry-specific classification rules ensures comparable gross profit margins over time.
Table of Contents
- What counts as revenue, net sales, and COGS?
- How do you calculate cost of goods sold?
- What does gross profit margin tell you?
- Worked examples: retail and service business
- Common mistakes when calculating gross profit
- When gross profit needs a professional set of eyes
- Where gross profit falls short as a metric
- Why gross profit calculation differs by industry
- What the numbers actually demand from you
- Sources
- FAQ
What counts as revenue, net sales, and COGS?
Before you calculate anything, get your inputs straight, because a wrong number here throws off everything downstream.
Revenue (or net sales) is what you actually keep from selling, not what you invoiced. Take gross sales, subtract returns, discounts, and allowances, and you get net sales. If a customer returns a faulty product or you knock 10% off for a bulk order, that adjustment happens before you even start the gross profit calculation.
COGS is the direct cost of producing or buying what you sold. For a product business, that’s stock purchases, freight-in, and direct production costs. For a service business, it’s the direct labour and subcontractor time billed to that specific job.
What does NOT belong in COGS:
- Rent and utilities for your office or shop
- Marketing and advertising spend
- Admin salaries (bookkeeper, receptionist, owner’s own draw)
- Bank charges, insurance, and general overhead
Lump these into COGS and your gross profit looks better than it actually is. That’s a mistake that catches out a lot of first-time business owners doing their own books.
How do you calculate cost of goods sold?
COGS calculation differs slightly depending on what kind of business you run, but the logic stays consistent: work out what you had, what you added, and what’s left.
- Retailers and wholesalers: Opening stock + purchases + direct costs (like freight) − closing stock = COGS. SARS’s small business tax guide uses exactly this formula for calculating cost of sales on tax returns, and it’s worth using the same structure for your own management accounts so the two match at year end.
- Manufacturers: Add raw materials, direct labour on the production line, and factory overhead (machine costs, factory rent, supervisor wages tied to production) to the retail formula above. Skip factory overhead and you’ll understate COGS, which inflates gross profit and can mislead you on pricing.
- Service businesses: There’s no physical stock, so COGS is direct labour hours and subcontractor fees tied to delivering that specific service. A bookkeeping firm’s COGS is the hours its accountants bill to clients, not the office manager’s salary.
Whichever formula applies to you, match your stock count dates to the exact period you’re reporting on. Counting stock a week late or early distorts closing stock and throws your whole calculation off.
Pro Tip: Count stock on the same date every reporting period, even if it’s not the last day of the month. Consistency in timing matters more than perfect precision on any single count.
What does gross profit margin tell you?
Gross profit margin turns a rand figure into a percentage you can actually compare across products, months, or competitors. The formula, as Xero’s guide to gross profit margin lays out, is: gross profit ÷ revenue × 100.
Say a business earns R500,000 in revenue and has a strong gross profit margin, meaning a substantial portion of every rand sold stays in the business before operating costs are deducted.
What the number tells you:
- A high margin usually means strong pricing power or low direct costs relative to sale price (typical of software or consulting).
- A low margin often signals thin pricing, expensive inputs, or a highly competitive market (common in grocery retail or basic manufacturing).
- A margin that’s falling over time without a strategy shift usually means input costs are rising faster than your prices.
Track margin monthly, not just annually. A slow slide from 45% to 38% over six months is a warning sign a single year-end review will miss entirely.
Worked examples: retail and service business
Numbers make this concrete. Here’s a retail example and a service example, both using the same core formula.
Retail business: Revenue, opening stock, purchases during the year, and closing stock values are used to calculate cost of goods sold and gross profit margin.
Service business: Revenue and direct consultant salaries and subcontractor fees tied to client work are used to determine COGS and gross profit margin.
In a spreadsheet, if revenue sits in cell B2 and COGS in B3, gross profit is =B2-B3 and margin is =(B2-B3)/B2*100. Format the margin cell as a percentage with one or two decimal places, and keep COGS as a positive number so the subtraction doesn’t double-negative on you.
Common mistakes when calculating gross profit
Small errors here compound fast, especially once you’re comparing margins month to month or product line to product line.
- Misclassifying overhead as COGS. Rent, marketing, and admin salaries do not belong in cost of goods sold. Doing this inflates gross profit and hides a business that’s actually less profitable than it looks.
- Cut-off errors. Counting stock on the wrong date, or including a purchase invoice from the next period, skews both opening and closing stock figures.
- Inconsistent inventory valuation. Switching between FIFO, weighted average, or another method between periods makes your gross profit trend meaningless because you’re no longer comparing like with like.
- Not reconciling purchase records against supplier statements. Missing invoices understate purchases and distort COGS.
Run a quick monthly checklist: reconcile purchases to supplier statements, confirm your stock count date, and check nothing operational has crept into COGS. A cloud accounting system that tracks inventory and direct costs automatically removes most of this manual error entirely.
Pro Tip: Set a recurring calendar reminder for the same stock count date every month. Businesses that count sporadically almost always have messier gross profit trends than those on a fixed schedule.
When gross profit needs a professional set of eyes
Gross profit is a starting point, not the whole financial picture, and getting it wrong has real consequences on a SARS return. Specialist accounting firms work with SMEs and startups on this kind of financial cleanup, from forensic accounting reconstruction to real-time dashboards that track COGS per SKU or per job as it happens, rather than once a year at tax time.
An accurate gross profit figure feeds directly into your Annual Financial Statement and your SARS provisional and annual tax returns. Get COGS wrong and you either overpay tax on inflated profit or understate income and invite a SARS query.
If your business does any manufacturing costing, holds physical inventory across multiple locations, or you’ve had a SARS query about cost of sales, that’s the point where a professional accountant earns their fee back several times over.
Complex inventory reconciliation, multi-product manufacturing costing, and tax queries are exactly the triggers that mean it’s time to bring in help rather than keep patching a spreadsheet.
Where gross profit falls short as a metric
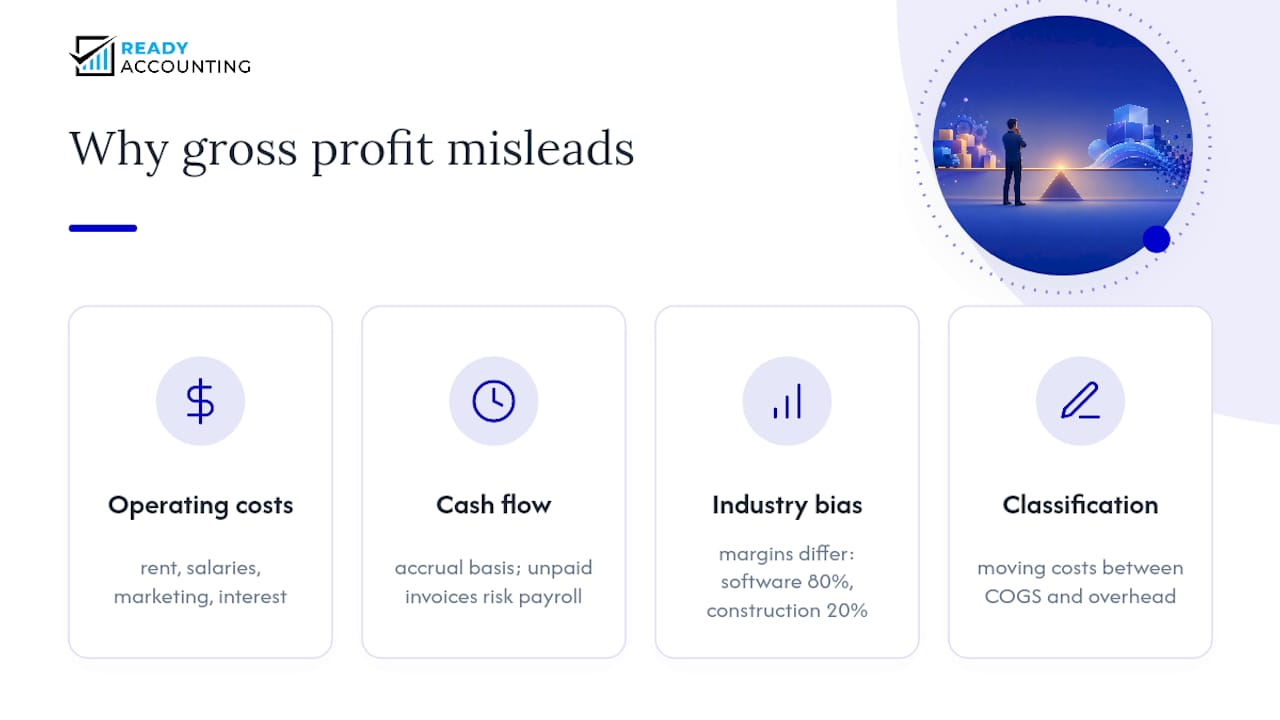
Gross profit tells you almost nothing about whether the business as a whole is profitable. A company can post a healthy 50% gross margin and still lose money once rent, salaries, marketing, and interest on debt are factored in. That gap between gross profit and the bottom line is exactly what separates it from net profit, which accounts for every operating expense.
Gross profit also says nothing about cash flow. A business can show strong gross profit on paper while sitting on unpaid invoices and struggling to make payroll, because gross profit is calculated on an accrual basis, not on cash actually received.
It’s a poor standalone tool for comparing businesses across industries, too. A software company with 80% gross margin and a construction firm with 20% aren’t failing or succeeding by the same yardstick. Direct costs simply work differently in each model, and comparing the raw percentage across sectors tells you very little.
Finally, gross profit is easy to manipulate through misclassification. Shift a genuine overhead cost into COGS, or the reverse, and the number moves without the underlying business changing at all. Treat gross profit as one input into a broader financial picture that includes operating expenses, cash flow, and net profit, never as the full verdict on how a business is doing.
Why gross profit calculation differs by industry
The formula stays fixed. What counts as a “direct cost” doesn’t, and that’s where industry practice diverges sharply.
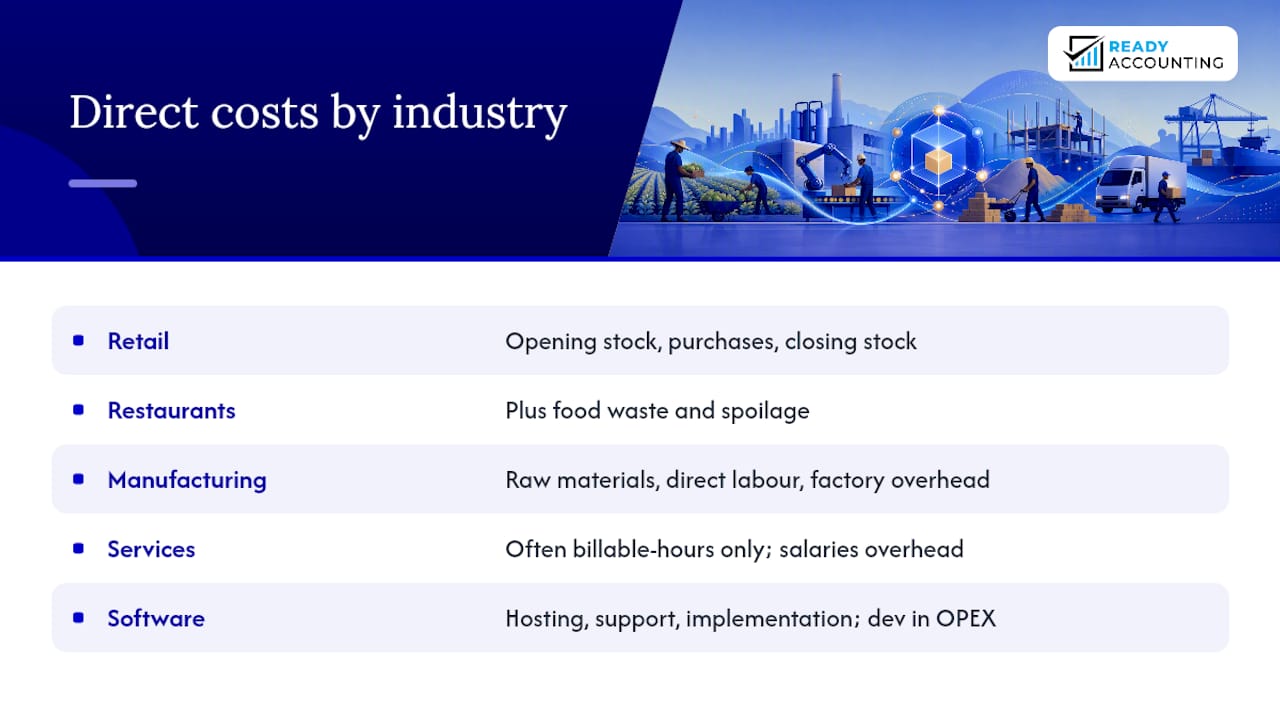
Retailers keep it simple: opening stock, purchases, closing stock. Restaurants add a wrinkle, folding in food waste and spoilage as part of cost of sales, since a portion of every ingredient purchased never makes it to a plate sold.
Manufacturers carry the heaviest COGS calculation of any sector. Raw materials, direct labour on the line, and a slice of factory overhead (electricity, equipment depreciation, supervisor wages) all belong in the number. Leave out factory overhead and gross margin looks artificially strong, right up until pricing decisions based on that number start losing money on every unit.
Service businesses, by contrast, often have no COGS in the traditional sense at all. A law firm or marketing agency’s main “cost” is staff time, and some choose to run gross profit on billable-hours-only, treating all salaries as overhead instead. Software companies split the difference: hosting costs, customer support, and implementation staff often count as COGS, while product development sits in operating expenses.
None of these variations are wrong. They reflect real differences in how each business actually earns money. What matters is picking a consistent method for your own business and industry, and sticking with it every period so your gross margin trend actually means something.
What the numbers actually demand from you
Most gross profit advice online treats the formula as the hard part. It isn’t. Revenue minus COGS is arithmetic a ten-year-old can do. The real skill, the one that separates businesses with reliable numbers from businesses that get a nasty surprise at tax time, is disciplined classification and consistent timing.
Conventional advice tends to stop at “here’s the formula” and leaves out the part that actually costs businesses money: inconsistent stock counts, overhead quietly bleeding into COGS, and inventory valuation methods that change from year to year without anyone noticing. Those are the errors that turn a 45% margin into a mystery.
If you take one thing from this article, prioritise your stock count date and your COGS classification rules before you worry about which spreadsheet formula to use. Get those two things locked down and consistent, and the calculation itself becomes the easy part. A cloud accounting setup that automates inventory tracking removes most of the manual risk, but only once your underlying classification is sound.
— Johan
Sources
- Tax guide for small businesses - SARS
- Gross Profit: What It Is and How to Calculate It - Investopedia
- Gross profit margin: formula, example and how to improve | Xero NZ
South African readers should treat the SARS guide as the authority on how cost of sales is treated for tax purposes specifically, since general explainers don’t always reflect local reporting rules.
FAQ
How do you calculate gross profit percentage?
Divide gross profit by revenue and multiply by 100: (Gross Profit ÷ Revenue) × 100.
What is the formula for gross profit?
Gross profit equals revenue minus cost of goods sold: Revenue − COGS = Gross Profit. Investopedia’s breakdown confirms this as the standard formula used across accounting and finance.
What is the formula for the gross profit rate?
The gross profit rate, more commonly called gross profit margin, is calculated as (Gross Profit ÷ Revenue) × 100. It expresses gross profit as a percentage of revenue rather than a rand amount, which makes it useful for comparing performance across periods or products.
What’s the difference between gross profit and net profit?
Gross profit is revenue minus direct production or service costs (COGS). Net profit goes further, subtracting all operating expenses, interest, and tax from gross profit, so it reflects the actual bottom-line profit of the business.
Do service businesses calculate COGS differently to retailers?
Yes. Retailers use opening stock plus purchases minus closing stock, while service businesses generally calculate COGS as direct labour and subcontractor costs tied to delivering a specific service, since there’s no physical inventory involved.